Marketplace margin analytics: why the platform's own reports are not enough
Marketplace back offices show revenue, not profit. Where the margin goes — commissions, logistics, storage, returns — and how to assemble honest unit economics per SKU.
Short answer: a marketplace back office shows revenue and sales, not profit. Real margin per SKU can only be calculated by joining the platform’s API data with the cost of goods from your own accounting system — and for sellers at any scale the gap between estimated and actual profit routinely reaches 15–30%.
Here is exactly where the margin goes, and how to build honest accounting.
Why the back office lies, or rather does not tell you everything
A marketplace back office is the platform’s reporting to the seller, not your management analytics. The key costs are in there, but they are spread across different reports with different granularity and different periods:
- Commission depends on the category and changes. You see it retroactively in the weekly settlement report, not at the moment of sale.
- Logistics is charged for every journey the item makes, including the trip to a customer and back when they refuse it. An item with a high purchase rate and a “traveller” item look equally profitable in the back office.
- Storage is charged daily and per warehouse. It matters for bulky goods and dead stock, and it does not appear in the sales report at all.
- Returns and damage land in different reports and different periods from the original sale.
- Advertising is a separate dashboard and a separate export, and attributing the spend to a specific SKU is a task in itself.
And most importantly: your cost of goods is not in there. Without it, any report is a report about revenue, not profit.
What honest unit economics looks like
The formula on paper is simple:
SKU profit = Revenue
  − Cost of goods (purchase + delivery to warehouse + packaging)
  − Platform commission
  − Logistics (every journey, including refusals)
  − Storage (actual days, actual warehouses)
  − Returns and damage
  − Advertising attributed to the SKU
  − Penalties and other deductions
The difficulty is not the formula, it is the data: eight terms live in five different sources with different keys and different periods. Joining them by hand in a spreadsheet costs a seller one or two days a week and breaks the first time an export format changes.
How it is built technically
The architecture we build for sellers is standard and boring, and that is its virtue:
- Collectors against the platform APIs: sales, settlements, logistics, storage, advertising, stock. The key nuance is that marketplace APIs are unstable — rate limits, changing formats, data corrected retroactively. So every raw response is stored as it arrived, in a staging layer, and the views are recomputed. When the platform rewrites history, the analytics survives it.
- Cost of goods from the accounting system, by batch, including delivery and packaging. This is the one source only you have.
- Joining by SKU or barcode through a mapping table. Item codes almost never match between the platforms and your accounting system, so that table becomes a critical reference.
- A margin view: profit by SKU, category and period, trends, and alerts — this SKU has gone negative, storage has eaten 40% of the margin, the purchase rate has dropped below 30%.
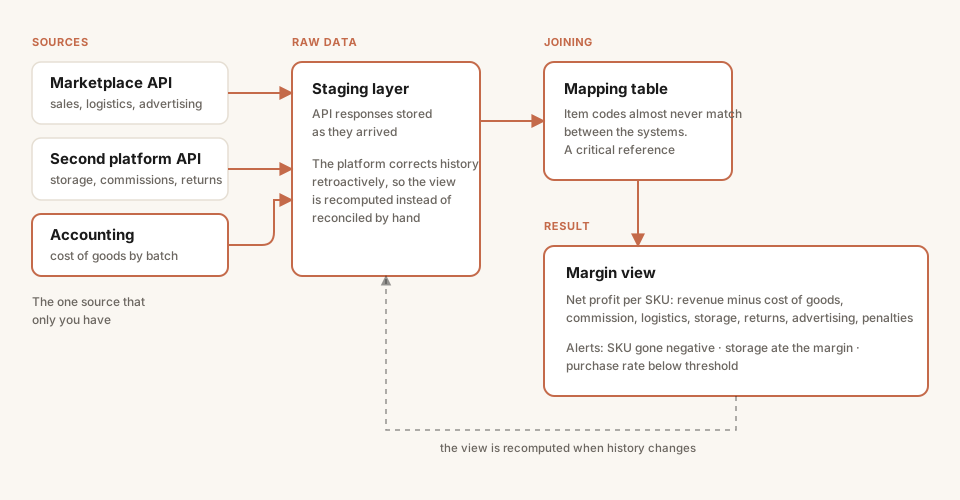
The key decision is the staging layer: when a platform corrects history retroactively, the view is recomputed instead of someone reconciling discrepancies by hand.
Typical findings in the first weeks of such a system: 10–20% of the assortment is being sold at a loss, usually bulky items with a low purchase rate, and the revenue flagships turn out to be middling on profit.
Off-the-shelf services or your own analytics?
The honest answer: start with the off-the-shelf ones. They cover competitor monitoring and basic economics for a modest monthly fee.
Your own analytics becomes justified when:
- the assortment runs to hundreds of SKUs across several platforms and you need an end-to-end picture — marketplaces plus wholesale plus retail — with cost of goods from your accounting system;
- you have your own logic for distributing costs, for example advertising and photography attributed to the brand rather than the SKU;
- the analytics has to feed back into processes: automated pricing, purchase orders, a stop list on supplying loss-making SKUs.
On timelines: an MVP with collectors, cost of goods and a margin view takes five to eight weeks; a full BI system with alerts and a what-if price calculator takes two to three months. More expensive than an off-the-shelf service, but it is your data, your calculation methodology, and no subscription that grows with turnover.
In short
- The back office shows revenue; profit per SKU cannot be calculated without cost of goods from your own system.
- The main margin eaters — logistics on refusals, storage and returns — are invisible in the sales report.
- Start with off-the-shelf services; build your own when you need the end-to-end picture and feedback into processes.
- Technically this is ETL plus a staging layer of raw API data plus views: boring, reliable, and it pays for itself on the first loss-making SKU it finds.
More on the service in marketplace margin analytics, and the adjacent solution is a marketplace aggregator for managing sales.
Facing a similar problem?
Tell us what you are building. We will walk through the architecture and give you a budget range in one call.